

Before you sign up for a whole life, endowment or investment-linked plan, your adviser has to hand you a benefit illustration. In Singapore this document sets out what your policy might pay you, year by year, under certain assumptions. Many people flip straight to the biggest number on the last page, which is usually the least reliable one.
This guide walks through a benefit illustration in Singapore section by section: which figures are promised, which are only projections, where the fees hide and what questions to ask before you commit. It is general information, not financial advice. Your policy wording and your insurer are always the final word.
What a Benefit Illustration Is and Why You Get One
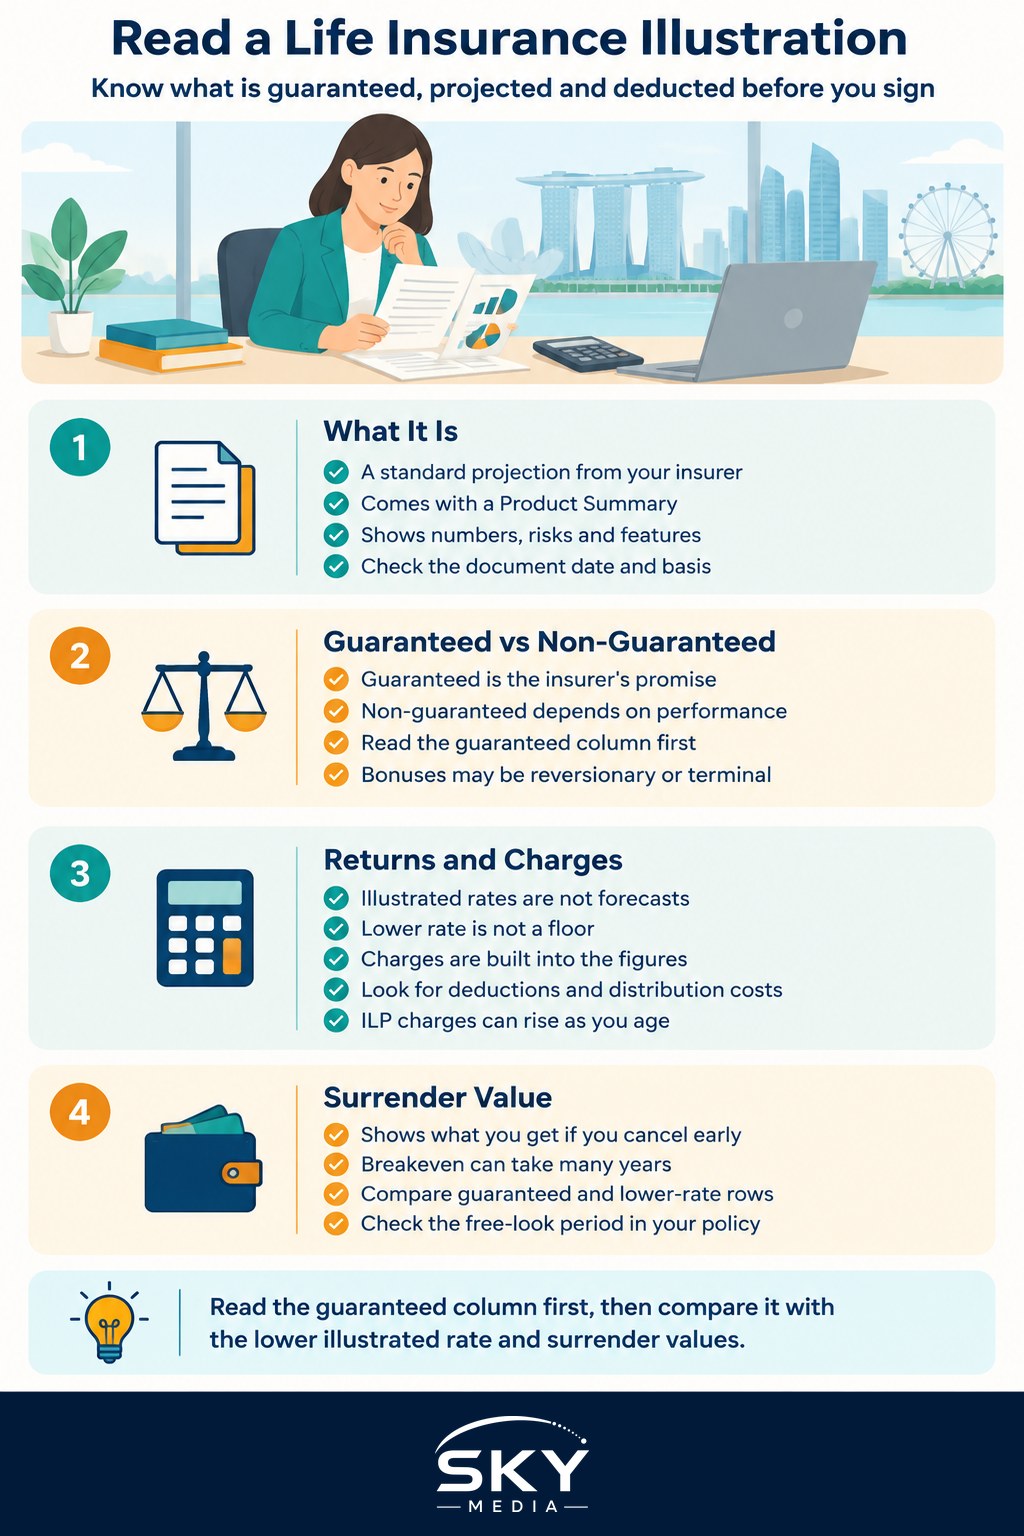
A benefit illustration is a standardised projection that insurers prepare for policies with a savings or investment element. It usually comes together with a Product Summary, which describes the plan’s features, exclusions and key risks in plain language. The illustration is the numbers side; the Product Summary is the words side. Read both.
The format follows industry guidelines set through the Life Insurance Association Singapore (LIA) and requirements from the Monetary Authority of Singapore (MAS), the financial regulator. The common layout lets you compare illustrations across insurers. The guidelines and the illustrated rates can be revised over time, so check the date printed on your document and ask whether it reflects the current basis.
Pure term plans carry no cash value, so they have little to illustrate. If you are still deciding between protection-only and savings-type plans, our explainer on term vs whole life insurance in Singapore is the place to start.
Guaranteed and Non-Guaranteed: The Split That Matters Most
Almost every table in a benefit illustration is divided into two kinds of column.
- Guaranteed benefits are what the insurer is contractually committed to pay, provided you keep paying premiums as agreed. These are usually modest.
- Non-guaranteed benefits depend on how the insurer’s participating fund (for par policies) or your chosen funds (for investment-linked policies) actually perform. Bonuses, dividends and fund growth all fall here.
The total column adds the two together, which is why it can look impressive beside a small guaranteed figure. When you assess a plan, read the guaranteed column first and ask yourself whether you would still be happy if that was all you ever received.
For participating policies, non-guaranteed bonuses typically come in two forms. Reversionary bonuses are added to the policy over time and, once declared, generally become part of the benefit. Terminal bonuses are paid only when the policy ends through death, maturity or surrender, and they can be cut or removed before then. The illustration will tell you which type applies; the Product Summary explains how the insurer decides them.
Reading the Two Illustrated Rates of Return
Non-guaranteed projections are shown at two assumed investment rates of return: a higher one and a lower one. These rates are set by industry guidelines and appear on the illustration itself, so read them off your own document rather than relying on what a friend’s policy showed.
Key points to understand:
- They are not forecasts. The rates are a common yardstick so every insurer illustrates on the same basis, not a prediction of what the fund will earn.
- The lower rate is not a floor. Actual returns can fall below it.
- Your effective yield is lower. After charges, the return on your premiums is below the illustrated rate. Some illustrations show this yield directly, which helps when comparing plans.
- Past performance is shown separately. Par policies often summarise the fund’s historical returns and bonus history. Useful context, but not a guarantee.
A simple test: compare the projected total at the lower rate against the total premiums you will have paid. If the gap is slim after twenty years, the plan’s value to you rests mostly on its protection features, not on savings.
Where the Fees and Costs Appear
Insurance costs are not billed separately like a bank charge. They are built into the numbers, so you need to look for them.
- Effect of deductions. Many illustrations include a table showing how much the policy’s value is reduced by expenses, charges and the cost of insurance cover. This is the clearest signal of what the plan costs you over time.
- Total distribution costs. This shows the commission and related costs of selling and servicing the policy, often year by year. These tend to be heavy in the early years, which is why early surrender values are low.
- Charges for investment-linked policies (ILPs). Look for the premium allocation rate (the share of each premium that is actually invested), fund management fees, policy fees and insurance charges. ILP insurance charges usually rise as you age.
Ask your adviser to point to each of these. If they cannot, pause.
Surrender Value and the Cost of Leaving Early
The surrender value is what you get back if you cancel the policy before it matures. For most savings-type plans it starts at zero or close to it, and only climbs past your total premiums paid after many years. The year in which this happens is often called the breakeven point, and it is one of the most practical figures in the whole document.
Find the row where the guaranteed surrender value first exceeds total premiums paid, then do the same at the lower illustrated rate. If either is decades away, be honest about whether income or relocation plans could force you to stop paying before then.
Most policies also have a free-look period after you receive the policy documents, during which you can cancel and get most of your premium back, less certain costs. The length and conditions are stated in your policy, so check them on the day it arrives.
| Section of the illustration | What it tells you | What to check |
|---|---|---|
| Guaranteed benefits | The minimum the insurer is committed to pay | Whether these alone meet your needs |
| Non-guaranteed benefits at two rates | Projected bonuses or fund growth under set assumptions | How wide the gap is between the higher and lower rate |
| Effect of deductions | How much charges and insurance costs reduce your value | How these compare across plans of similar premium |
| Total distribution costs | Commission and selling costs over time | How heavy they are in the first few years |
| Surrender value table | What you get back if you cancel in a given year | The breakeven year at the guaranteed and lower-rate figures |
A Step-by-Step Way to Read Your Document
Set aside half an hour with the illustration, the Product Summary and a calculator.
- Confirm your age, smoker status, premium, payment term and policy term. A wrong detail changes every figure that follows.
- Note the total premiums you will pay over the payment term.
- Read the guaranteed death benefit and the guaranteed maturity or surrender value at key ages, such as 10, 20 years in, and at 65.
- Read the totals at the lower illustrated rate for the same years. Treat the higher-rate column as optimistic.
- Find the effect of deductions and distribution cost tables and write down the cumulative figures.
- Locate the breakeven year for surrender.
- Read the Product Summary for exclusions, waiting periods and riders, and check whether rider premiums are included in the illustration.
If you came to Singapore with a policy from elsewhere, the numbers may follow a very different format. Our guide on keeping your China life insurance after moving to Singapore covers that situation.
Questions to Ask Before You Sign
- What portion of the projected maturity value is guaranteed?
- Has this participating fund ever cut its bonuses?
- How do the distribution costs compare with a similar plan elsewhere?
- Would a cheaper term plan plus separate saving or investing suit my goals better?
You can also compare plans on compareFIRST, the comparison portal run by MoneySense and the LIA. For background on how coverage types fit together, see life insurance explained in Singapore, and if you also have group cover from an employer, factor it in as described in understanding workplace benefits in Singapore.
Read properly, a benefit illustration is the most honest page you will be given. Read the guaranteed column first, and only sign when the numbers make sense on a cautious reading.
Frequently Asked Questions
What does a benefit illustration not show me about a policy? It shows projected numbers under set assumptions, not the full policy terms. Exclusions, waiting periods and rider conditions are in the Product Summary and the policy contract. Read all three together rather than relying on the illustration alone.
Can I ask my adviser for a benefit illustration for more than one plan to compare? Yes, and it is a good idea. Ask for illustrations on the same premium and term so the figures line up, and compare the guaranteed column, the deductions and the breakeven year. You can also use the compareFIRST portal.
Should I buy a savings plan or just buy term insurance and invest the rest? It depends on your goals, discipline and risk comfort. Term cover is cheaper protection, while savings-type plans bundle protection with a longer-term savings element and costs. A licensed financial adviser can compare options for your situation.
What happens to my illustration if I add a rider later? Adding a rider changes the premium and the benefits, so you should request a fresh illustration or an updated one. Check whether rider premiums are included in the figures. Do not assume the numbers on the original document still apply.
How reliable are the projected figures if my plan runs for decades? They are only illustrations and become less certain the further out they go. Non-guaranteed amounts depend on actual fund performance, and even the lower illustrated rate is not a floor. Treat the guaranteed column as your baseline.
Official sources: MoneySense