
The small screen on the back of your camera lies to you. Under Singapore’s fierce midday sun it looks too dark, so you brighten everything and blow out the sky. In a dim hawker centre it looks bright, so you underexpose. The histogram in photography is the honest second opinion that ignores the screen and the ambient light and tells you exactly how your exposure really looks. Once you can read it, you stop guessing and start nailing exposure in any light.
This guide explains what the histogram is, how to read it, and how to use it on both phones and dedicated cameras to fix the exposure problems our tropical light throws at you.
What The Histogram Shows
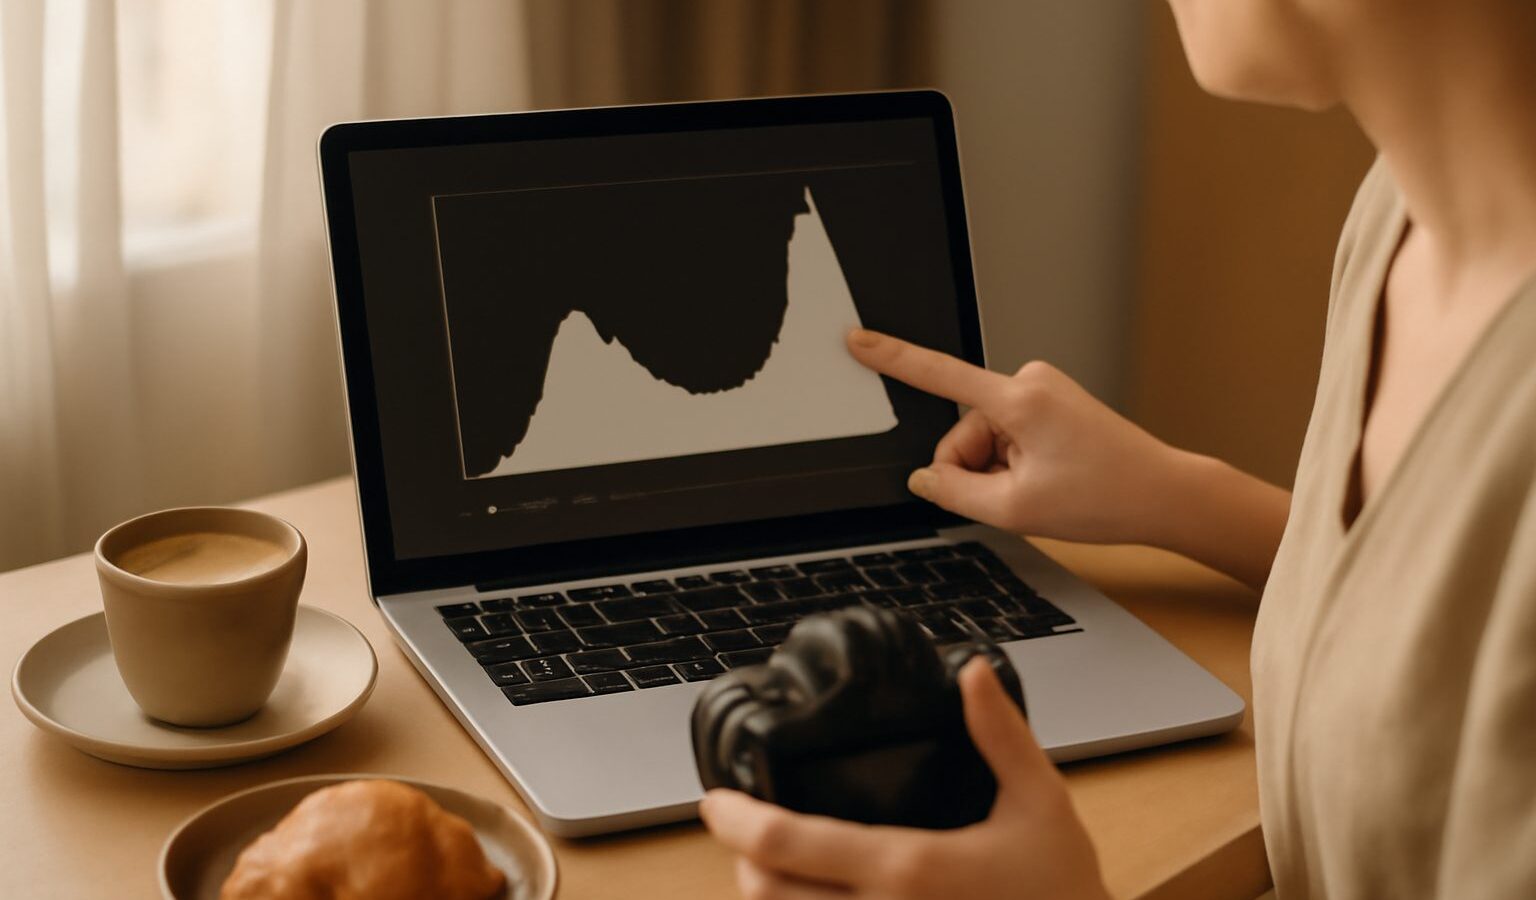
A histogram is a simple bar graph of the brightness in your photo. The horizontal axis runs from pure black on the far left to pure white on the far right, with the midtones in between. The vertical axis shows how many pixels fall at each brightness level. A tall spike means lots of pixels at that brightness, a low area means few.
That is the whole thing. Reading left to right, the graph tells you how much of your image is dark, how much is midtone, and how much is bright. It is not a picture of your composition, only of the light in it.
Because it counts actual pixel values, the histogram is not fooled by a glary screen or a dim room. It shows the truth of your exposure regardless of how the preview looks to your eye, which is exactly why it matters so much outdoors here.
Reading The Shape Correctly
There is a common myth that a good histogram should be a neat hill in the middle. That is not true. The right shape depends entirely on the scene.
A bright, airy photo of the sky over East Coast Park will lean right, with lots of light tones. A moody night shot of the Marina Bay skyline will lean left, full of dark tones. Both can be perfectly exposed. The shape should match the scene, not some ideal curve.
What you are really watching for is clipping, which is detail lost at the extremes.
Clipped highlights show as the graph slamming into the right edge and piling up there. This means areas have gone pure white with no detail, a blown sky or a burnt out highlight on skin. Recovered detail there is often gone for good.
Clipped shadows show as the graph jammed against the left edge. This means areas have gone pure black with no detail, crushed shadows where texture disappears.
A little clipping is sometimes fine and even intended, such as a light source in the frame or a deliberately dark background. The goal is not a perfect shape but keeping the detail you care about away from the edges where it gets destroyed.
Using The Histogram In Bright Singapore Light
Our climate makes the histogram genuinely useful rather than academic.
The blown sky problem. On a bright day, the sky and clouds are far brighter than the land. Evaluative metering often exposes for the ground and pushes the sky off the right edge. Glance at the histogram, see the spike jammed right, and reduce exposure with exposure compensation until the highlights pull back inside the graph.
The dark face problem. A person shaded by a hat or backlit by a bright sky can sit against the left edge while the background is fine. The histogram shows a gap on the right and a pile on the left. Add exposure or use fill, and watch the shadows lift off the edge.
High contrast midday scenes. Near the equator, noon light creates a huge range between highlight and shadow that no single exposure can fully hold. The histogram may touch both edges at once. Decide what matters more, protect the highlights if the sky and detail count, and accept some shadow loss, or come back at golden hour when the range is gentler.
Night and blue hour. For a dark cityscape the histogram sits mostly to the left, which is correct. Just make sure the bright signs and lights are not clipping hard on the right, and that your shadows are not so crushed that noise takes over when you brighten later.
Where To Find The Histogram
You do not need special gear to use a histogram. Both phones and cameras offer one.
| Device | Where to find it | Live or after |
|---|---|---|
| Dedicated camera, playback | Press info or display while reviewing a shot | After the shot |
| Dedicated camera, live view | Enable histogram in the display overlay | Live, before shooting |
| Mirrorless viewfinder | Add histogram to the electronic viewfinder display | Live, before shooting |
| Phone, pro camera mode | Turn on the histogram overlay in settings | Live, before shooting |
| Phone, editing app | Open a photo, the histogram sits in the adjust panel | After the shot |
The most powerful option is a live histogram, available on most mirrorless cameras and in many phone pro modes. It updates as you change settings, so you can set exposure correctly before you even take the shot, instead of chimping at the result afterwards.
Acting On What The Histogram Tells You
Reading the graph is only useful if you know what to do next. The corrections are straightforward.
- If the highlights are clipping on the right and you want to keep that detail, reduce exposure. Lower exposure compensation, use a faster shutter speed, close the aperture, or drop ISO.
- If the shadows are clipping on the left and you need that detail, increase exposure by the opposite means.
- If both edges clip at once, the scene’s range exceeds what one shot can hold. Prioritise the more important end, usually the highlights, or consider blending exposures or returning in softer light.
- If the graph bunches in the middle with gaps at both ends, you have a low contrast scene, common on a hazy or overcast day, which you can leave as is or add contrast to in editing.
Protecting highlights is usually the safer bet, because bright detail that clips to pure white is rarely recoverable, while shadows often hold some detail you can lift later, especially from a raw file.
Making The Histogram A Habit
The histogram becomes second nature quickly if you use it deliberately for a while.
- Turn on the live histogram in your camera or phone pro mode and leave it on, so exposure feedback is always in view.
- After important shots, check the histogram rather than the preview image, especially outdoors where the screen misleads you.
- Learn your camera’s highlight warning, often called blinkies, which flashes clipped areas on the review image, a fast companion to the histogram.
- Combine it with your metering choice and exposure compensation, so the histogram confirms whether your reading was right.
The histogram in photography is not a technical hurdle, it is a shortcut to confident exposure. It cuts through the guesswork of a dim or glary screen and shows you the truth every time. Learn to read its edges, act on what you see, and you will bring home well exposed photos from the harshest midday glare and the darkest night skyline alike.
Explore more: Using Exposure Compensation, Understanding Metering Modes, How to Set White Balance, and Understanding Autofocus Modes.